Understanding the path that your customers take from first learning about your brand to making a purchase—and beyond—can be a game changer for your business. Funnel visualization is an effective tool that can help you clearly see where your customers are in the buying process. By breaking down each stage and analyzing the data at each touchpoint, you can make smarter decisions, increase conversions, and improve customer experiences.
Funnel visualization works in conjunction with customer journey mapping to provide a clearer picture of your customer’s experiences. It allows businesses to track how prospects engage at each stage of the sales funnel, making it easier to optimize marketing efforts and refine strategies that keep customers coming back. Let’s dive into a comprehensive discussion of funnel visualizations and how they can help you better understand and improve your customer journey.
Introduction to Funnel Visualization
What is Funnel Visualization?
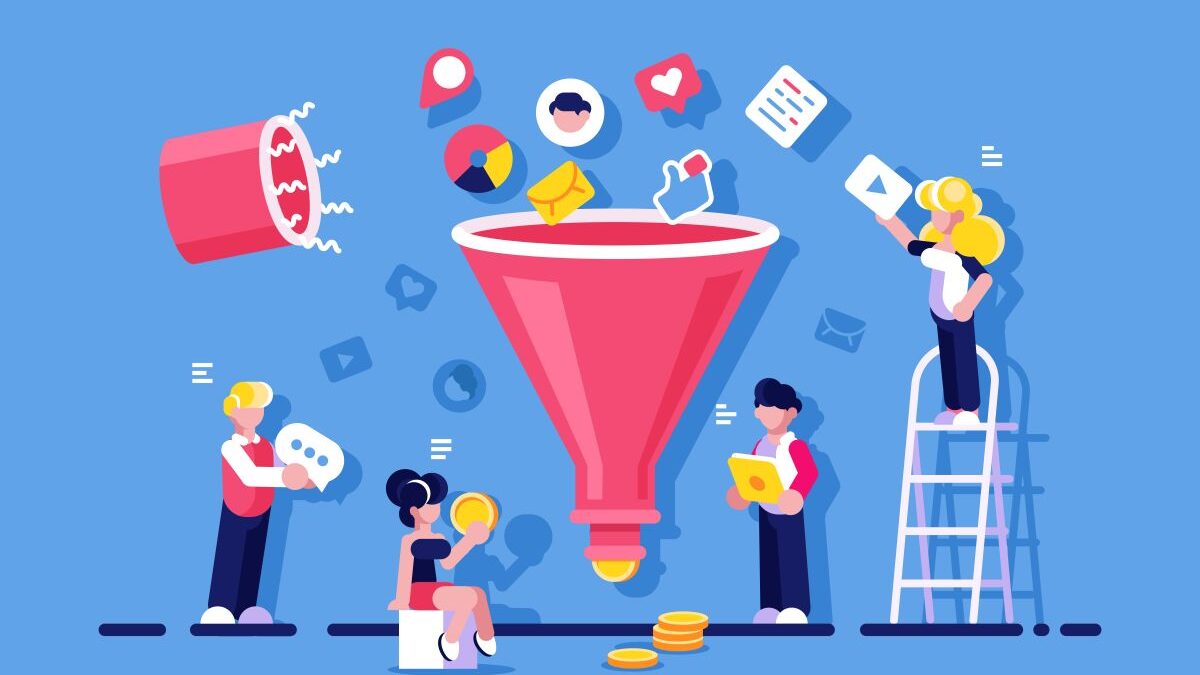
Funnel visualization is a method of tracking and analyzing the steps customers take from the moment they first engage with your business until they complete a desired action, such as making a purchase. It typically breaks down the journey into distinct stages, showing how many customers move from one stage to the next. Each stage represents a point where you can optimize your marketing and sales efforts.
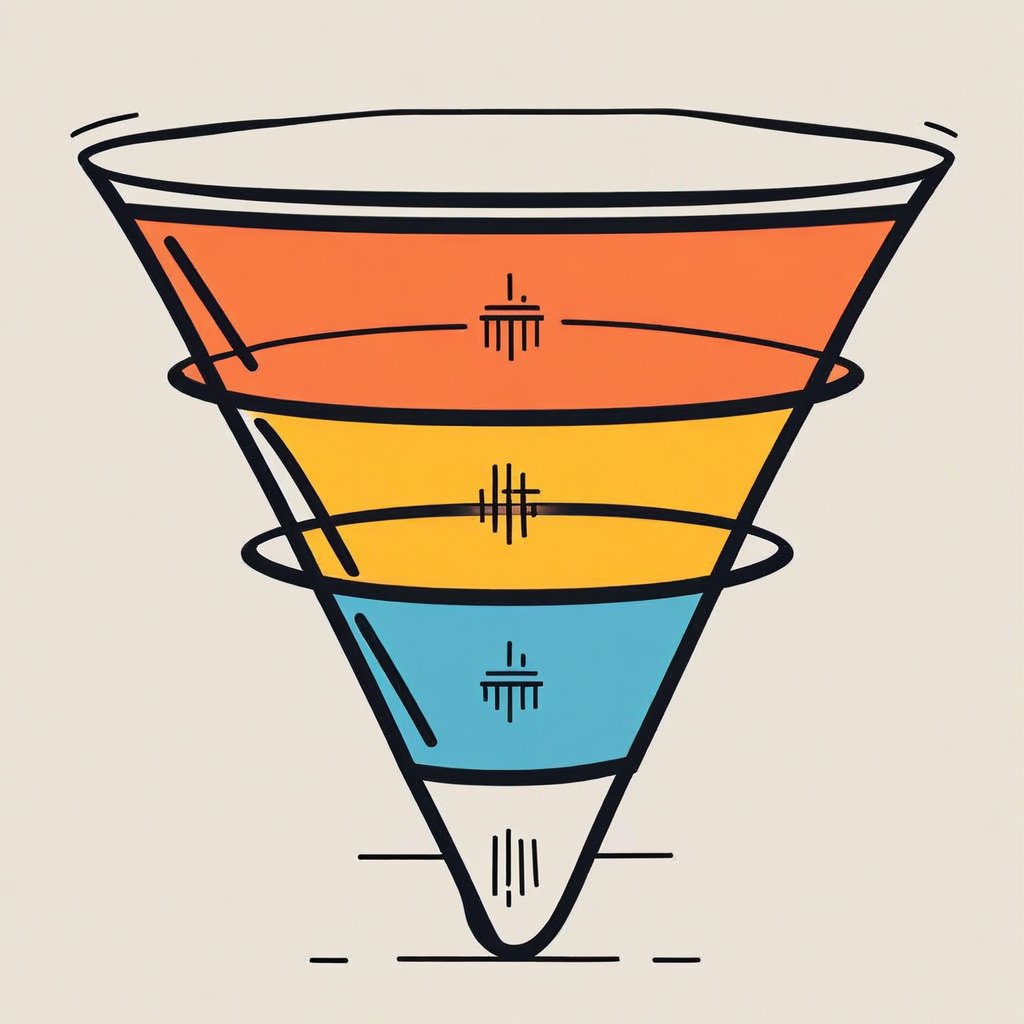
This process involves creating a visual representation of the funnel, typically in the form of a chart or diagram, where each funnel step is clearly marked. The funnel narrows as it moves from top to bottom, symbolizing the increasing likelihood of customers converting to paying customers as they progress through each stage.
Why is Funnel Visualization Important?
Funnel visualization is crucial for businesses because it helps identify where customers are dropping off, which stages are most successful, and where improvements can be made. It allows businesses to make data-driven decisions that lead to better targeting, more effective marketing, and ultimately, higher funnel conversion rates. By clearly seeing how prospects move through the funnel, businesses can adjust their strategies to guide more leads through each stage and convert them into customers.
Customer Journey Overview
What is the Customer Journey?
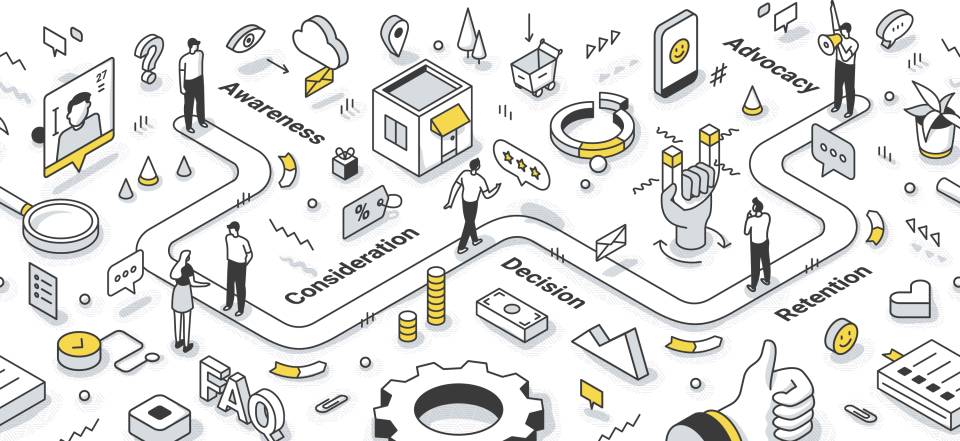
The customer journey refers to the series of steps a consumer goes through from becoming aware of a brand to making a purchase and beyond. It includes every interaction a customer has with your brand, from seeing an ad or reading a blog post to experiencing your product or service. Understanding the customer journey helps businesses map out how prospects engage at various touchpoints and what influences their decisions.
Key Components of a Customer Journey Map
A customer journey map is a tool that visually outlines the entire journey a customer takes with your brand. It typically includes:
- Touchpoints: The points of interaction between the customer and your brand, like visiting your website, receiving an email, or talking to customer service.
- Customer Goals: What the customer hopes to achieve at each stage of their journey.
- Emotions: How the customer feels at different points in the journey (e.g., excited, confused, frustrated, satisfied).
- Pain Points: The obstacles or challenges customers experience along the way.
- Opportunities: Ways to improve the experience, address pain points, and better meet customer needs.
Mapping out the customer journey helps businesses better understand the emotional and psychological experiences customers go through, which can inform strategies for building stronger relationships and driving conversions.
Ready to improve user journeys through funnel visualization?
Contact Growth Hackers
Stages of the Customer Journey
Awareness: Initial Contact and Brand Recognition
The first stage of the customer journey is awareness. This is when a potential customer first becomes aware of your brand or product. They might encounter your business through an ad, a social media post, a search engine, or word of mouth. At this stage, customers are just beginning to learn about what you offer, so your goal is to capture their attention and make a strong first impression.
For example, a customer might see an ad for your product while browsing social media. This is the start of their journey with your brand. The awareness stage is all about visibility and recognition, and funnel visualization at this stage can help track how well your marketing efforts are generating awareness.
Consideration: Research and Evaluation of Options
Once a customer is aware of your brand, they move to the consideration stage. At this point, they are actively researching and evaluating different options to solve their problem or meet their need. Customers might compare your product or service with competitors, read reviews, and check out more detailed information on your website.
The key during this stage is to provide value and answer potential customers’ questions. Funnel visualization here helps you track how many customers move from awareness to consideration and how they interact with your content. By analyzing data on what content resonates most during this stage, you can optimize your website and marketing materials to keep prospects engaged.
Purchase: Decision-Making and Transaction
The purchase stage is when customers make the decision to buy. They’ve gathered the information they need, evaluated their options, and now they are ready to take action. It’s essential to make this step as smooth and seamless as possible. Offering a simple checkout process, clear pricing, and an easy way to make a purchase are key factors here.
Funnel visualization at this stage helps you see how many of your leads convert into customers. If you notice a significant drop-off in this stage, it might indicate a problem, such as a complicated checkout process or unclear product information. Identifying this early allows you to improve the customer experience and reduce friction.
Post-Purchase: Follow-Up and Loyalty Stages
The post-purchase stage is often overlooked, but it’s critical for building customer loyalty and encouraging repeat business. After a purchase, businesses can follow up with customers through email marketing, surveys, or loyalty programs. Providing excellent post-purchase service, like easy returns and personalized offers, can help turn first-time buyers into long-term customers.
Funnel visualization here allows you to track the success of your follow-up strategies and identify areas where you can improve customer retention. If customers aren’t engaging with your post-purchase emails or joining your loyalty program, it’s an opportunity to tweak your approach and better meet their needs.
Key Elements of Funnel Visualization
Touchpoints: All Interactions Between the Customer and the Brand
Touchpoints are any interactions that occur between your customer and your brand. These include visiting your website, engaging with an ad, reading a social media post, making a purchase, or contacting customer service. Every touchpoint offers an opportunity to engage with your customers and guide them further down the funnel.
Tracking these touchpoints is essential for understanding how customers engage at each stage. Funnel visualization helps you map out where customers are interacting with your brand, allowing you to optimize these touchpoints for better engagement and conversion rates.
Emotions: Customer Feelings at Each Stage
Understanding customer emotions at each stage of the journey is essential for improving the customer experience. At different points in the funnel, customers may feel excited, frustrated, confused, or satisfied. Recognizing these emotions can help businesses adjust their approach to make customers feel more positive about their experience.
For example, if customers are feeling confused during the consideration stage, it could mean your messaging isn’t clear. If they’re feeling frustrated at the purchase stage, it might be due to a complicated checkout process. Funnel visualization helps track these emotional shifts so that businesses can address any negative feelings and improve the overall experience.
Pain Points: Challenges Faced by Customers
Pain points are the challenges or obstacles customers encounter during their journey. These could be anything from a slow website to unclear product information, to a difficult purchasing process. Identifying pain points early in the funnel allows businesses to make adjustments that streamline the journey and reduce friction.
For example, if many customers drop off during checkout, it could be a sign that the process is too complicated. Funnel visualization helps highlight these areas of friction, so businesses can take action to resolve them and make the journey smoother for future customers.
Opportunities for Improvement: Areas Identified for Enhancing the Customer Experience
Funnel visualization helps identify areas where you can improve the customer experience. By analyzing where customers drop off and where they engage most, you can pinpoint areas that need improvement. This could involve simplifying the checkout process, creating more engaging content, or offering better customer support.
Tracking these opportunities and making data-driven improvements leads to a better overall customer journey, which can drive higher conversions and increased customer loyalty.
Creating Effective Customer Journey Maps
Steps to Create a Customer Journey Map
Creating a customer journey map is an important step in understanding how your customers interact with your brand. Here’s a step-by-step guide:
- Define Goals and Objectives: Before you start, be clear on what you want to achieve with your journey map. Are you focusing on improving conversions? Enhancing customer satisfaction?
- Research and Collect Data: Use data from surveys, customer interviews, and your Google Analytics account to gather insights into how customers move through their journey.
- Develop Buyer Personas: Craft comprehensive profiles of your target customers, focusing on their motivations, challenges, and behaviors.
- Identify Individual Steps and Interactions: Break down the customer journey into distinct funnel steps, such as awareness, consideration, and purchase.
- Visualize the Journey: Use charts, diagrams, or flowcharts to create a visual representation of the customer journey, making it easy to analyze and understand.
Visualizing the Journey in a Suitable Format
The format of your customer journey map will depend on your business needs. Whether it’s a simple linear map or a more detailed matrix, the goal is to make the journey clear and actionable for your team. Using visual tools allows you to easily spot patterns and areas for improvement.
Types of Customer Journey Maps
Linear vs. Cyclical Representations
A linear customer journey map is straightforward and represents a one-way path from awareness to purchase. This type of map is useful for businesses that focus on a single transaction or experience. However, many modern journeys are cyclical, where customers may revisit stages or make repeat purchases. For businesses with recurring customers, a cyclical representation might be more appropriate.
Matrix Format for Detailed Analysis
A matrix format is useful when you want to analyze customer behavior in more detail. This format displays the journey along multiple dimensions, such as touchpoints, emotions, and actions, allowing for a comprehensive analysis of how each factor influences the overall experience.
Future-State Maps for Ideal Scenarios
A future-state map represents the ideal customer journey based on your business’s goals. It shows the desired path customers should take, highlighting areas where you want to improve or refine the experience. These maps help businesses visualize what a successful customer journey looks like and set targets for improvement.
Enhance customer journeys with funnel visualization now!
Integrating Funnel Visualization with Customer Journey Mapping
Funnel visualization and customer journey mapping complement each other. While funnel visualization provides a clear view of how customers progress through the buying process, customer journey mapping offers deeper insights into their experiences and emotions. Together, they provide a comprehensive understanding of how customers interact with your brand, helping businesses optimize marketing efforts at each stage. Incorporating funnel analysis into this integration allows for more precise tracking of user behavior across stages.
The integration of both tools allows businesses to focus on improving every aspect of the customer experience, from the first touchpoint to post-purchase interactions.
Continuous Improvement Through Feedback Mechanisms
Customer feedback is essential for continuously improving the customer journey. By using tools like surveys, user testing, and customer reviews, businesses can gather insights into what customers like and dislike about their experience. Incorporating this feedback into your journey maps helps businesses stay responsive to customer needs and adapt their strategies accordingly.
Tools for Gathering Feedback
- Surveys: Collect feedback directly from customers about their experience at various stages.
- User Testing: Conduct tests to see how customers interact with your website or product, identifying pain points and areas for improvement.
- Customer Reviews: Monitor online reviews to understand customer sentiments and identify common issues.
Feedback analysis also complements website performance analysis, allowing businesses to address functional issues that might impede the customer journey.
FAQs on Funnel Visualization
What is funnel visualization?
Funnel visualization is a way of tracking and visualizing the steps users take toward completing a goal on a website or app. It maps out the series of actions leading to a conversion, helping you identify where users drop off or succeed. This tool is essential for understanding user behavior and improving the funnel conversion rate.
What does the funnel visualization report allow?
The funnel visualization report backfills data to show how many users make it through each step of a process. It highlights where the most significant drop-offs occur, giving you insights into areas that may need improvement. The funnel visualization report shows you where to optimize the key parts of your user journey.
What is the best way to visualize a funnel?
The best way to visualize a funnel is with a step-by-step graph that clearly shows the conversion paths at each stage. A horizontal or vertical funnel chart can help you see where users are exiting and where they are advancing. This makes it easier to pinpoint any issues in the process.
What is the purpose of a funnel visual?
The purpose of a funnel visual is to help you track user behavior, identify friction points, and improve your conversion analysis process. It provides a clear view of how users progress toward a goal and where they get stuck. This helps you make data-driven decisions to enhance user experience and increase conversions.
Final Thoughts on What is Funnel Visualization and How it Can Help Your Business Understand Your Customer Journey
Funnel visualization is an invaluable tool for businesses seeking to understand the customer journey. By tracking how prospects move through each stage, from awareness to post-purchase, businesses can gain insights into their behavior, emotions, and pain points. Combined with customer journey mapping, it helps businesses improve the overall customer experience, optimize marketing efforts, and increase conversions. By continuously refining the journey based on data and feedback, companies can create better experiences that keep customers engaged and loyal.
If you need help in visualizing or optimizing your marketing funnel, Growth Hackers can help.
Growth Hackers is a leading sales funnel agency and we understand the power of funnel visualization and how it directly impacts business growth. By using the strategies outlined in our comprehensive approach, we help you analyze your customer journey step by step. Through funnel visualization, we track user skips and pinpoint key areas that need optimization. This allows us to craft precise, data-driven strategies designed to move potential customers seamlessly from one stage to the next, boosting your conversion rates and sales.
We apply all the strategies discussed here—tracking key touchpoints, understanding user emotions, and identifying pain points—so you can make smarter, faster decisions. Our team of experts is dedicated to creating growth solutions that are not only effective but also sustainable, ensuring your business continues to thrive long after we’ve helped you set the foundation.
If you’re ready to grow your business to the next level and see tangible results, don’t hesitate to reach out. Contact Growth Hackers today and let’s work together to turn your growth goals into reality!


