In business, understanding the Venn diagram is crucial to success. It is a visual representation of how two, three, four or more circles overlap. The overlapping region is where the most important information exists. In this blog post, we will discuss the three components of the Venn diagram, its history, advantages, and more.
So, read on to soak up all information about the Crucial Venn Diagram Components!
What Is a Venn Diagram?
A Venn diagram, also called an Euler diagram, is a graphical way of representing the relationships between sets. It consists of a series of overlapping circles, each of which represents a set. The intersection of the double set is represented by the area where the circles overlap. In contrast, the union of the double set is represented by the combined area of the two circles.
Venn diagrams are useful for visualizing relationships between different groups of items. For example, they can be used to show how two groups of people differ in their interests or opinions.
They can also be used to plan events or projects by mapping out all possible combinations of tasks that need to be completed. In short, Venn diagrams or Euler diagrams are versatile tools used in various situations.
The History and Origin of Venn Diagrams
The Venn diagram is a simple yet powerful tool for visualizing relationships between data sets. Named after English logician John Venn, who popularized the diagram in the 1880s, the Venn diagram is used to illustrate the principles of set theory.
Set theory is a branch of mathematics that deals with the relations between objects, including the concept of “membership” in a set. Essentially, a Venn diagram represents sets and their relations to one another in a visually appealing way.
The beauty of the Venn diagram lies in its simplicity. Using just a few circles, it can illustrate even the most complex set of relationships. And because it relies on basic geometric shapes, it can be understood and used by people of all ages and backgrounds.
Today, Venn diagrams are used in fields as diverse as advertising, education, medicine, and psychology. They remain an essential tool for understanding and communicating relationships between data sets.
Venn Diagrams Symbols
There are three main types of Venn Diagram Symbols.
Union (∪)
The union of all sets – i.e., the Universe of elements within X and Y represents a uniting force that brings together people with different interests, values, or concerns into one big family rather than many little ones; it’s like an umbrella for our community to protect its members from rain drops (or hail storms).
Intersection (∩)
Represents all elements shared or common within the selected sets. The intersection of set X and Y would represent an element between them, like how two roads may intersect but still be separate entities at their respective edges.
It can also symbolize diversity among individuals who share certain traits while remaining unique from one another due to different contributions that make up what we call ” mankind.”
Complement (XC)
Let’s understand what XC means. It represents whatever is not in a particular set; thus, everything outside our little Universe will be called complement (or opposite) to said element or objects within that space-time continuum we call life on Earth! An equation showing this relationship can be seen as U/A, where you refer to those aspects which make up your existence while A stands for anything else – like, you say, the Universe itself!
What Is a Venn Diagram Used For?
Venn diagrams are a convenient way to compare and contrast two or more things visually. For example, you could use a Venn diagram to compare and contrast different types of apples, different animal species, or political ideologies. To create a Venn diagram, draw two overlapping circles.
Then, within each circle, list the qualities of the thing you’re comparing. Where the circles overlap, you can list the qualities shared by both things. For example, if you compare red apples with green apples, you might list “red” in one circle and “green” in the other. Where the circles overlap, you would list “fruit.”
You can also use Venn diagrams to compare more than two things. To do this, add more circles to your diagram. For example, if you were comparing apples, oranges, and bananas, you would need three circles.
Venn Diagram Examples
There are three types of Venn diagram examples.
- The most basic Venn diagram is the two-circle diagram, which shows the relationship between the double set of information.
- The three-circle diagram is similar to the two-circle diagram but has a third circle that intersects the other two horizontally or vertically.
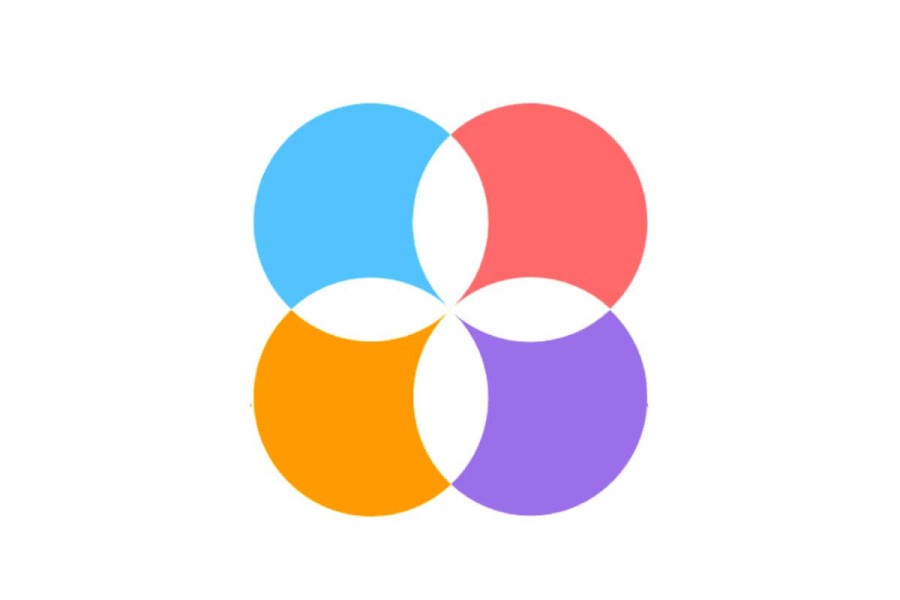
- The four-circle diagram is less common, but you can use it to show the relationships between four sets of information.
The middle sections where the sets overlap in each of these diagrams are called the intersection. We will further explain the three types of diagrams below.
Two-Circle Diagram
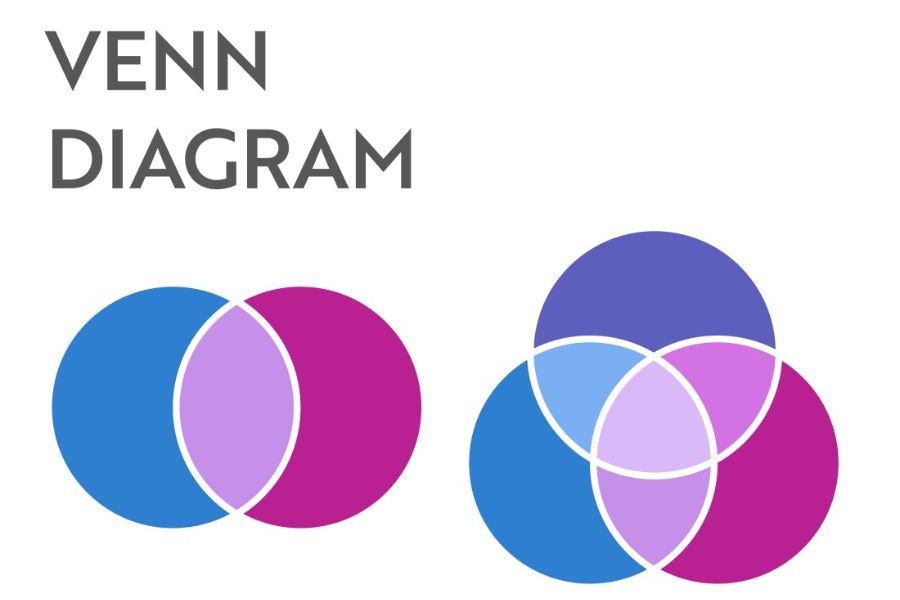
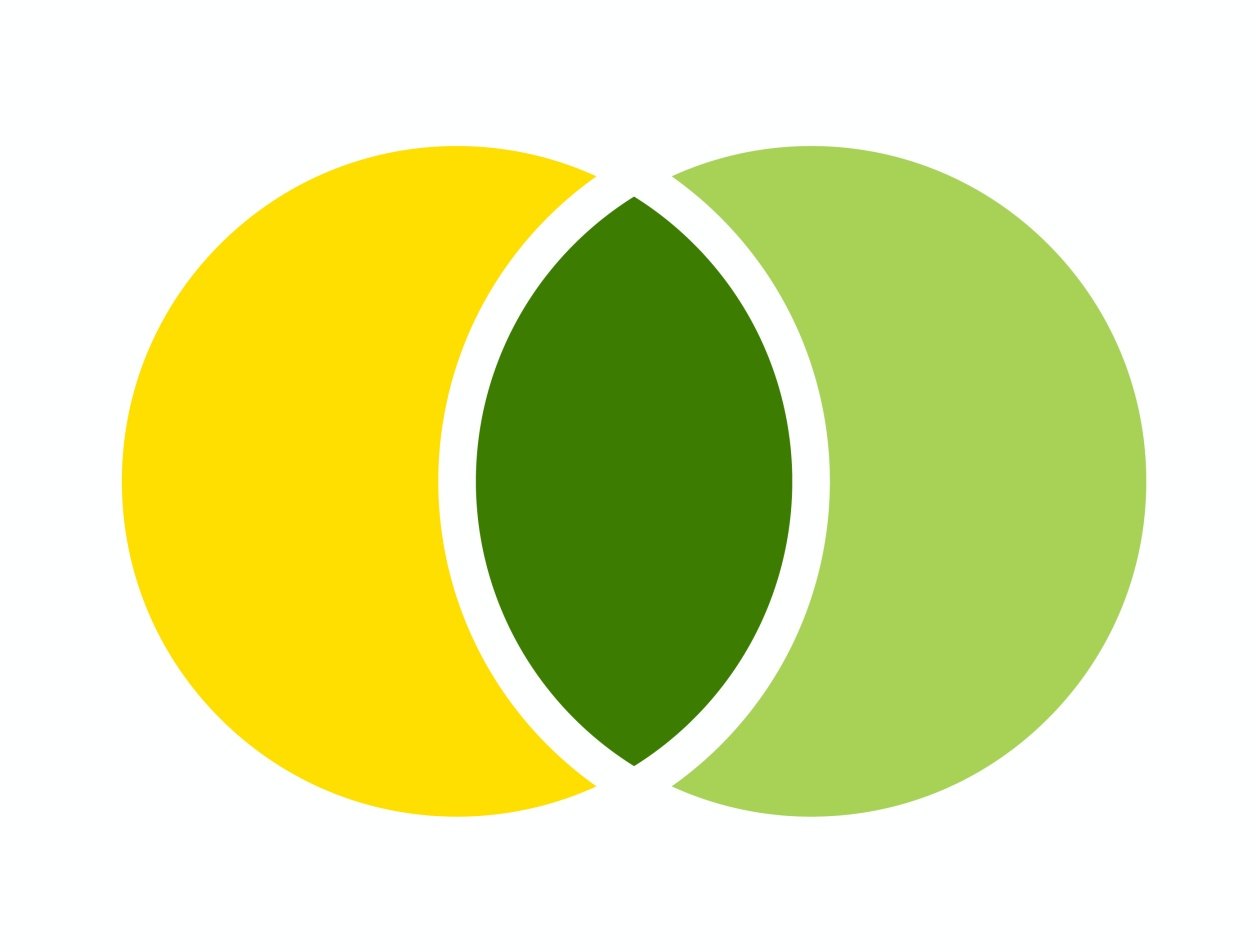
A two-circle diagram helps visualize relationships between two data sets. The diagram consists of two overlapping circles, with each circle representing a set of data. The area of overlap between the two circles represents the shared elements between the two sets.
For example, if you were to create a Venn diagram to compare and contrast dogs and cats, the area of overlap might represent commonalities, such as being pets or having four legs. Moreover, you can use this type of diagram to identify similarities and differences between any two sets of data.
Do you want to use the main Venn diagram components to easily visualize your business strategies?
Contact Growth Hackers
Three-Circle Diagram
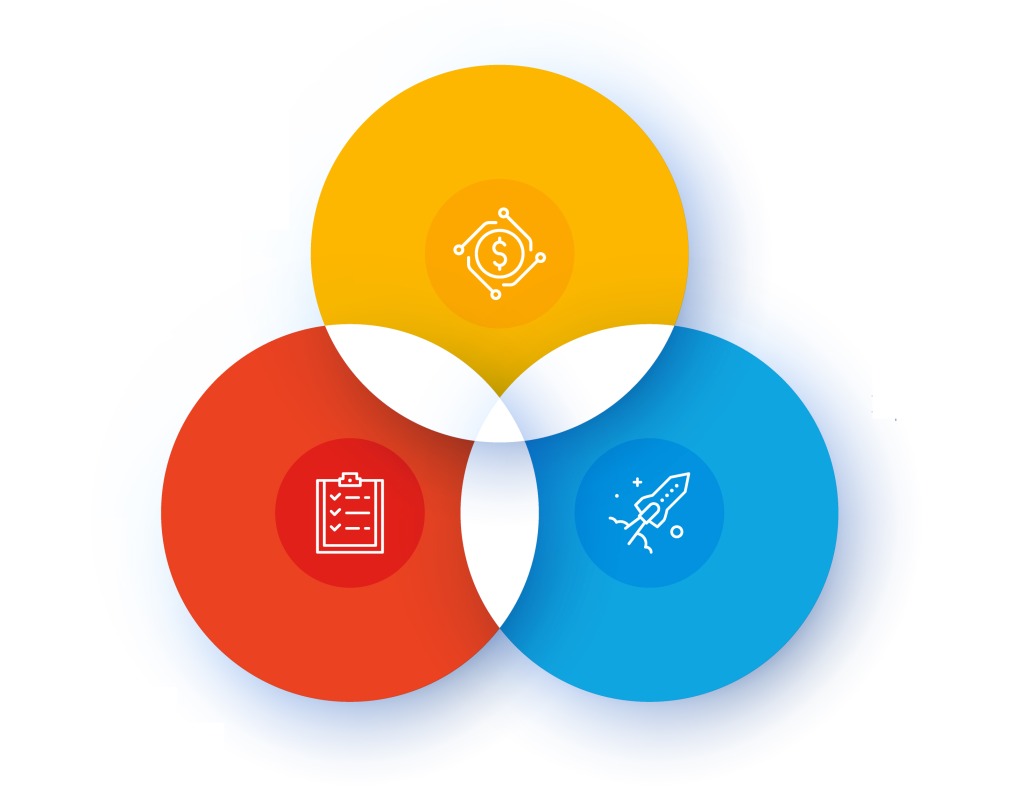
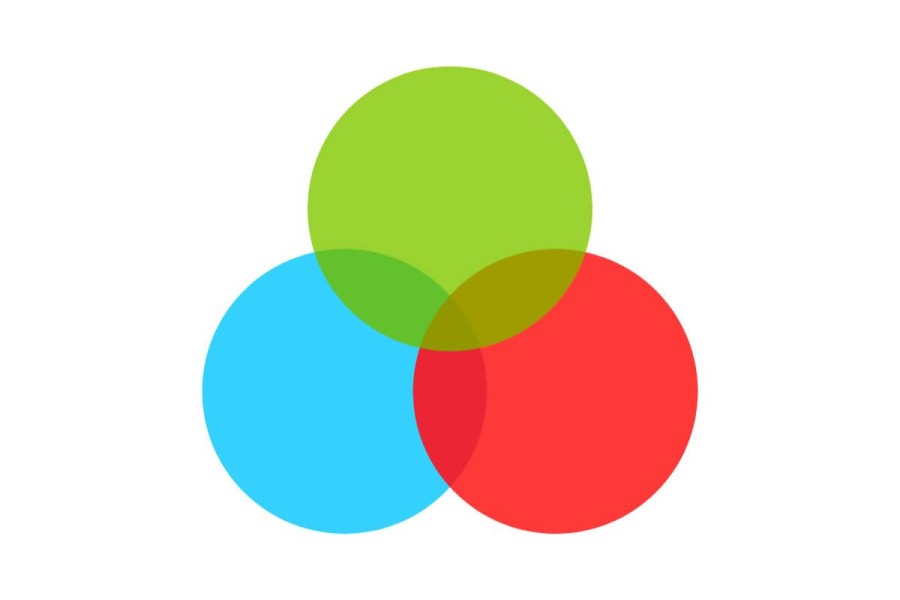
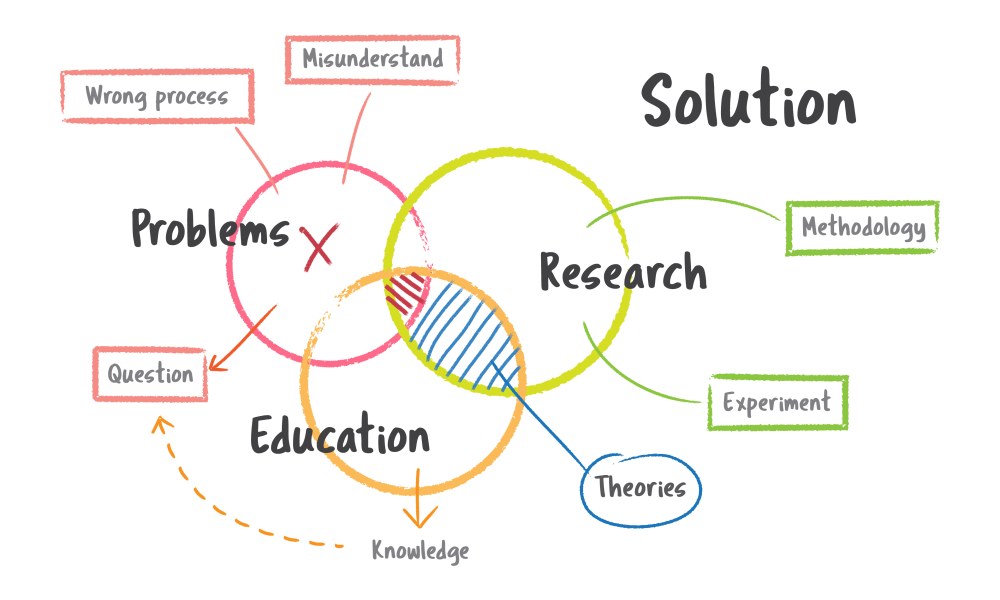
A three-circle diagram is a type of chart that is used to compare and contrast three different items. The three items are represented by circles, and the areas where the circles overlap represent the similarities between the items. The parts of the circles that do not overlap represent the differences between the items.
You can use three-circle diagrams to compare and contrast any three things, including people, ideas, objects, or events.
Four-Circle Diagram
A Four-Circle Diagram consists of four overlapping circles, each representing a different category. The overlapping areas represent the shared characteristics of the categories. The diagram can be used to compare and contrast four different things or to show the relationship between four different things.
The Benefits of the Venn Diagram
We will outline a few benefits of the Venn Diagram below:
To Visually Organize Information
Venn diagrams are useful tools for visualizing the relationships between sets of data. You can use them to see the commonalities between two sets of items and the differences. For students, they can be a helpful way to organize information and see the logic behind a concept. For professionals, they can be used for visual communication to depict the relationships between different data sets.
To Compare Two or More Choices
Making decisions can be tough. We want to choose the best possible option, but with so many choices available, it cannot be easy to know where to start. A Venn diagram allows you to compare two or more choices and see what they have in common versus what might distinguish them. This can be especially helpful when selecting an important product or service to buy.
To Solve Complex Mathematical Problems
Mathematicians are always looking for new ways to solve complex problems. Venn diagrams are graphic organizers that allow mathematicians to organize information and visually see connections between different concepts. For instance, let’s say you’re trying to solve a problem that involves three variables: x, y, and z. Using a Venn sketch, you can map out the affinities between these variables and see how they interact with each other. This helps you to identify patterns and come up with a solution more quickly.
To Compare Data Sets, Find Correlations, and Predict Probabilities
Venn diagrams are an excellent source to compare data sets, find correlations, and predict probabilities. For example, comparing two data sets, you could use a Venn sketch to see where they overlap and differ. This comparison could then be used to find correlations between the two data sets. Similarly, suppose you were trying to predict the probability of certain events occurring. In that case, you could use a Venn sketch to see how likely those events will occur based on the relationships between different data sets.
To Reason Through the Logic
The Venn sketch can help reason through the logic behind statements or equations. For example, consider a Boolean statement such as “A or B.” A Venn sketch can visually represent this statement and see how it would change if the “or” were replaced with an “and.” This type of analysis can help understand the underlying structure of statements or equations and can also be used to predict how they might behave in different circumstances.
Venn Diagram Use Cases
The Venn diagram has many applications in business, education, and more. Let’s take a look at a few examples:
Math
The most common use for Venn diagrams is to teach basic concepts in mathematics, such as sets, unions, and intersections. However, they can also be used in more advanced mathematics to solve complex problems. In addition, Venn diagrams have been written extensively in scholarly journals. Set theory is an entire branch of mathematics devoted to studying sets and their properties.
Linguistics
In the world of linguistics, Venn diagrams have been used to study the commonalities and differences among languages. By plotting the features of different languages on a Venn sketch, linguists can see which features are shared by all languages, which are unique to certain languages, and which are found in some but not all languages. This kind of analysis can be invaluable in understanding the evolution and diversity of language.
Computer science
As a programmer, one of the most important tools in your arsenal is a good understanding of computer science. After all, without a solid foundation in the principles of computing, it would be impossible to write effective code. The Venn sketch is one of the most useful tools for visualizing computer science concepts. Programmers can use Venn diagrams to visualize language hierarchies, allowing programmers to see the relationship between different languages at a glance. They can also be used to compare and contrast diverse languages, helping programmers to choose the right tool for the job.
Business
You can also compare and contrast anything that can be depicted in sets. For businesses, this means they can be used to compare and contrast products, services, processes, or anything else. Venn diagrams are an effective communication tool to illustrate that comparison because they visually show the overlap between two or more things. This can help businesses see where their products or services are similar and different, which can help make decisions about branding, marketing, and more.
These are some of the ways that you can use Venn diagrams.
Get creative and use the vital Venn diagram components to your advantage!
How Many Categories Can a Venn Diagram Have?
There are different types of Venn diagrams based on the number of circles used. A two-circle diagram is used to compare and contrast two items, while a 3 circle diagram is used to compare and contrast three items. A four-circle sketch can be used in various ways, but one common way is to show how something relates to four other things.
What Is Venn Diagram with Example?
A Venn diagram is a graphical tool that shows all the possible logical relationships between three or more sets. Each circle in a Venn diagram represents one set, and the overlapping region between two circles represents the set that is common to both. For example, let’s say you’re hiring for three positions: marketing director, web developer, and customer service representative. You could use a three-circle Venn diagram to help you visualize how the candidates overlap.
What Do the Symbols Mean in Venn Diagrams?
Symbols in Venn diagrams can vary, but often they indicate the type of relationship between sets. For example, the intersection of two sets might be represented by a circle, while a rectangle might represent the union of two sets.
How Do You Solve a Venn Diagram?
There are a few ways to solve a Venn diagram. One way is to list all the intersections of the circles and then find the commonalities between them. Another way is to find all the circles’ unions and subtract their intersection. Whatever method you choose, it’s important to remember that a Venn diagram is solved by determining how much shared content is between each circle. So make sure you consider all the information in each circle when solving it!
Final Words About the Crucial Venn Diagram Components
Now that you know the three crucial Venn diagram components, you’re well on understanding this important tool. Venn diagrams can be used in various ways, from comparing and contrasting different programming languages to analyzing business processes. No matter how you use them, Venn diagrams are a helpful way to visualize relationships between sets. So don’t be afraid to get creative with your Venn diagrams and see what you can learn!
Growth Hackers is a remarkable growth hacking agency helping businesses from all over the world grow. There is no fluff with Growth Hackers. We help entrepreneurs and business owners use essential Venn diagram components to their advantage, generate qualified leads, optimize their conversion rate, gather and analyze data analytics, acquire and retain users and increase sales. We go further than brand awareness and exposure. We make sure that the strategies we implement move the needle so your business grow, strive and succeed. If you too want your business to reach new heights, contact Growth Hackers today so we can discuss about your brand and create a custom growth plan for you. You’re just one click away to skyrocket your business.

