The purpose of any growth marketing campaign is to complete one core objective.
And that’s to drive sustainable growth through increased conversions, revenue, and profits. To get there, growth marketers undertake a wide range of experiments to gauge user experience.
Why? To get down to the bottom of why an acquisition channel isn’t performing up to standard. Because of this, online growth experiments are crucial to your campaign’s success.
If you want to learn how to design, run, and analyze a growth experiment, this ultimate guide will give you the complete rundown.
Designing Growth Experiments: Understanding the AARRR Framework
The first step in running a growth experiment is nailing down the basics of the AARRR framework. You read that correctly. The AARRR framework is a hilarious but proven pirate acronym that stands for:
- Acquisition
- Activation
- Retention
- Referral
- Revenue
Dave McClure created the AARRR framework to show businesses how to achieve success through metrics that demonstrate true marketing growth.
By giving less value to vanity metrics and focusing on growth campaigns, McClure theorized that even small companies could outperform their larger competitors.
However, achieving this goal means that businesses need to focus only on acquisition channels that have the most potential for growth based on criteria such as:
- Conversion potential. Can the channel increase sign-ups, purchases, and opt-ins?
- Attraction. Can the channel attract enough people to convert?
- Costs. To maximize growth, how much will the channel cost to operate?
Before you can run a successful growth experiment, you’ll first need to dissect the AARRR format to know what each stage entails.
Let’s break it down.
Acquisition
The acquisition stage is the first point of contact between a prospect and your company.
In marketing, this is called the first touchpoint. Tracking acquisition metrics like traffic, sessions, and even bounce rates can help you identify which channels perform best.
It can also give you a better idea of how much your user acquisition costs are.
Activation
Activation takes it one step further than acquisition. It details the phase where a prospect engages with your business. It’s important to note that every business has its own definition of “engagement.”
For example, SaaS companies might identify engagement as a free trial signup. A marketing agency might instead define engagement as the moment someone signs up for a sales call. Similarly, a divorce mediation firm might determine engagement as a free 1-hour consultation.
Nonetheless, the most common website metrics for engagement are:
- Time spent on a web page
- Pages visited per session
- Bounce rate
Once you define what engagement means for your business, you can take a look at your acquisition channels and figure out which are performing up to the standard of your activation goals.
For example, let’s say that you strongly value the time people spend on your website. Your blog brings in 50,000 monthly visitors that spend roughly 18 minutes on your website.
Social media brings in 75,000 monthly visitors who spend an average of two minutes on your website. Based on your activation goal, your blog is bringing in more active traffic.
Making this judgment will help you avoid putting too much stock into vanity metrics (like website traffic in this case) and focus on what’s really driving business growth.
Retention
The retention stage is where you’ll continue interacting with prospects after activation. The most common retention channel is email marketing.
It’s the easiest and most proven way of keeping in touch with prospects as they travel further down your sales funnel. With email marketing, you can:
- Decreased customer churn — you’re constantly reminding your audience of your business.
- The improved lifetime value of your customers — you’re getting customers to convert continually.
Now that you understand what the retention stage is all about, the next step is figuring out how to track retention metrics. Ideally, you’ll need to look at data that shows continual engagement between your brand and your target audience.
These metrics could include:
- App and user dashboard logins
- Email newsletter open rates
- Repeat website sessions
Now, let’s move on to the next stage.
Need help running successful online growth experiments?
Contact Growth Hackers
Referral
The referral stage is meant to identify which acquisition channels or activation methods lead to more referrals. A referral is essentially a free conversion, so it’s extremely valuable on the scale of a growth experiment.
Nowadays, tracking referral metrics isn’t challenging. Here are some ways to pinpoint where your brand’s referrals are coming from:
- Referral promotion emails. You can track clicks and shares to see how they’re performing.
- Affiliate metrics. You can see how your affiliate campaign is doing from your user dashboard.
- Social media. You can run a referral contest on social media and check your acquisition channels to see progress.
And that’s all there is to cover about this stage. Let’s move on.
The revenue stage is when the prospect becomes a customer and spends money. Ideally, you should only focus on two metrics:
- Minimum revenue. This is the revenue you need to stay in business and pay essential overhead and operating costs.
- Break-even revenue. This is the minimum revenue you need to make a profit.
To maximize revenue, each of your growth experiments needs to yield:
- Low costs and high revenue
- High-volume acquisitions
- High-performance goals
Running and Analyzing Growth Experiments from Start to Finish
Understanding the AARRR framework is vital before running a growth experiment. Once you’re familiar with how this framework works, you can design a growth experiment.
With that said, here are all the steps you need to follow to run a growth experiment from start to finish.
Step #1: Perform an Audit
Growth experiments are no different than ordinary experiments. Both rely on using the scientific method to drive conclusions.
The first step of the scientific method is forming a hypothesis. You can’t do that without first figuring out what’s wrong with your acquisition channels in the first place.
The easiest way to do this is by performing a marketing audit. A marketing audit is a diagnosis of all your current campaigns, usually to generate data and identify issues.
Once you have this information on hand, you should use a competitor analysis tool to find out how your campaigns are running as compared to your toughest competitors.
Ultimately, the goal here is to find critical issues in your campaign and set benchmarks for where they should be.
Step #2: Form a Hypothesis
Your audit should give you the data necessary to judge your campaign’s performance.
Until you achieve progress with your experiment, you’ll usually have to rinse and repeat this step. For example, let’s say you’re spending a lot of your marketing budget on social media ads.
Based on acquisition data, you’re receiving minimal traffic and clicks from your ad campaign. Here are a few hypotheses you can draw:
- You’re targeting the wrong audience or using the wrong channel.
- Your ads aren’t configured properly.
- Your landing page is below par.
Remember, the purpose of a growth experiment is to drive revenue growth. Your hypothesis shouldn’t just solve a marketing issue. It should ultimately lead to business growth.
Step #3: Implementation
During this step, you’re going to put your hypothesis to the test. Most of the time, growth marketers conduct A/A and A/B tests to analyze specific marketing channels.
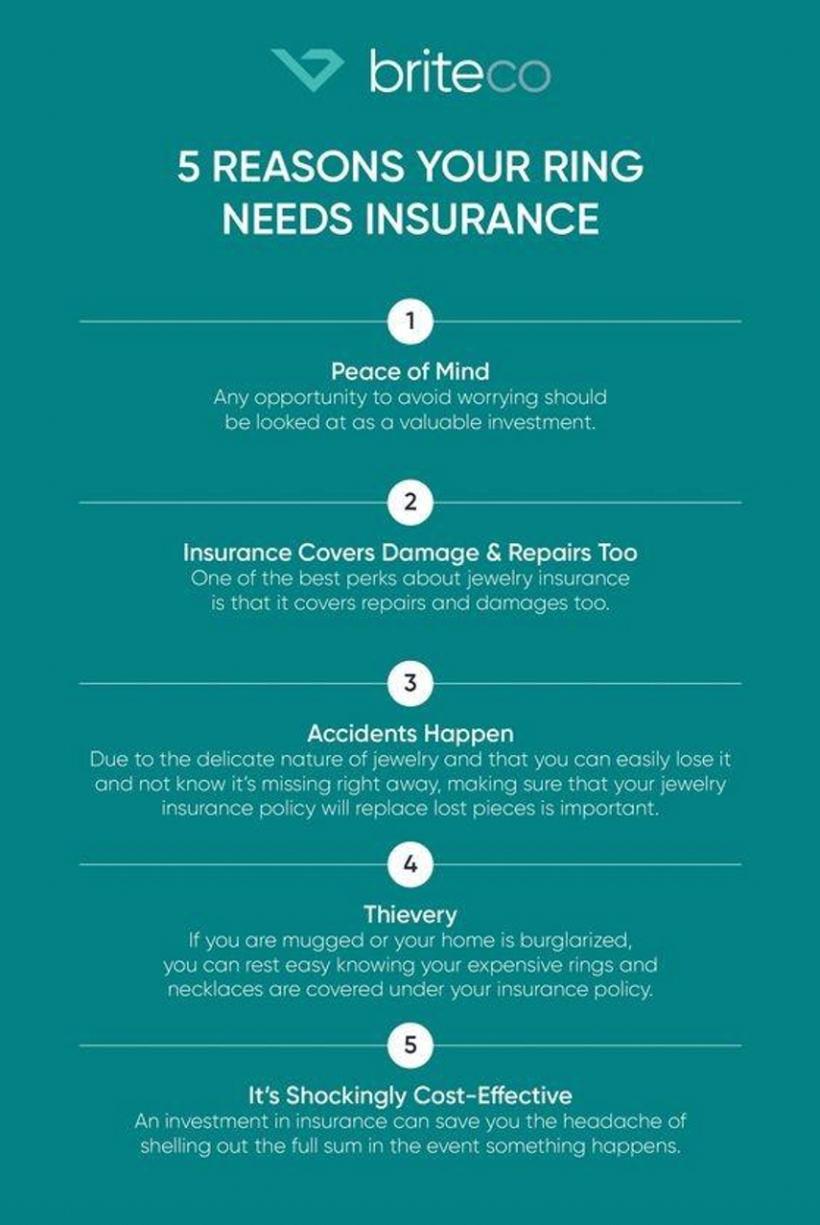
For example, when BriteCo wanted to rank for the keyword “cost to insure an engagement ring” they created the infographic below. This image simply and stylishly explains the importance of insurance for engagement rings.
The image alt text includes the keywords “ring insurance,” and “cost to insure an engagement ring.” This alt text helps to ensure that the infographic will be found when people search for these keywords on Google, and they’ll be taken straight to BriteCo’s landing page.
Infographics are a great way to break up text-heavy content and make it more visually appealing. They can also be a powerful tool for SEO, as they can help you rank your page on the specific keyword for both text and image searches.
To optimize an infographic for SEO, you need to make sure that the image alt text is relevant and informative. The alt text is the text that appears when an image isn’t able to load, and it’s also used by search engines to index images.
Use images to bring value to your audience and drive traffic to your website. Win-win.
Another smart tactic to leverage is pop-ups. These simple but effective eye-catchers are a golden opportunity for you to put a CTA right in front of your audience. Make it captivating and you can improve your conversion rates significantly.
Agent Advice managed to scale the growth of their Facebook community by adding a simple pop-up there with a catchy copy and CTA — inviting their website visitors to engage in yet another way with them.
They also included a section on their homepage with more information on what to expect from joining their private community, including networking, ideas by top agents on how to generate real estate leads, funny memes, and the latest real estate trends.
Tailor your CTA to your business goals and engage with your audience accordingly.
After running your own experiment, move on to the next step.
Unlock your digital potential today with online growth experiments!
Step #4: Collect Data
The only way to know if your experiment worked is by gathering data. The good news is that most marketing channels have dashboards that aid in data collection.
For example, you can hook a website to Google Analytics to measure performance. You can also check the dashboards for Facebook and Google Ads to gauge costs and growth.
Another common solution is using OAuth protocol, a standard protocol that allows users to authorize third-party applications to access their data without sharing their passwords.
For example, if you want to test how adding a social login option to your website affects your conversion rate, you can use OAuth to let users sign in with their Facebook or Google accounts. This way, you can collect user data and feedback more easily and securely.
Overall, data collection is a straightforward process. The caveat here is to ensure that you’re following proper data cleaning habits to make sure your conclusions are reliable and accurate.
Step #5: Draw Conclusions
The final part of running a growth experiment is drawing conclusions based on performance and data.
If your hypothesis were correct, the data would explicitly show it. If your hypothesis is wrong, you’ll need to start the process all over again until you’re left with successful experiments.
Closing Thoughts on Designing, Running and Analyzing Online Growth Experiments
Overall, conducting a growth experiment is a thorough, in-depth process for driving revenue and profits.
Following the basics in this guide will give you all the knowledge and tools to run an informative growth experiment so you can optimize your growth marketing campaign. Happy experimenting!
Growth Hackers is an award-winning growth marketing agency helping businesses from all over the world grow. There is no fluff with Growth Hackers. We help entrepreneurs and business owners conduct successful online growth experiments, increase their productivity, generate qualified leads, optimize their conversion rate, gather and analyze data analytics, acquire and retain users and increase sales. We go further than brand awareness and exposure. We make sure that the strategies we implement move the needle so your business grow, strive and succeed. If you too want your business to reach new heights, contact Growth Hackers today so we can discuss about your brand and create a custom growth plan for you. You’re just one click away to skyrocket your business.


